Note: After I wrote this post, some people helpfully pointed out in the comments (as I suspected might happen) that this phenomenon has been documented before, first as Berkson’s Paradox and later as “conditioning on a collider” in Pearl’s causal framework. Hopefully the post is still an interesting discussion, but please call it one of those names and not “the selection-distortion effect.”
A little while back I ran across an idea buried in an old paper of Robyn Dawes that really opened my eyes. It was one of those things that seemed really simple and straightforward once I saw it. But I’d never run across it before.[1] The idea is this: when a sample is selected on a combination of 2 (or more) variables, the relationship between those 2 variables is different after selection than it was before, and not just because of restriction of range. The correlation changes in ways that, if you don’t realize it’s happening, can be surprising and potentially misleading. It can flip the sign of a correlation, or turn a zero correlation into a substantial one. Let’s call it the selection-distortion effect.
First, some background: Dawes was the head of the psychology department at the University of Oregon back in the 1970s. Merging his administrative role with his interests in decision-making, he collected data about graduate admissions decisions and how well they predict future outcomes. He eventually wrote a couple of papers based on that work for Science and American Psychologist. The Science paper, titled “Graduate admission variables and future success,” was about why the variables used to select applicants to grad school do not correlate very highly with the admitted students’ later achievements. Dawes’s main point was to demonstrate why, when predictor variables are negatively correlated with each other, they can be perfectly reasonable predictors as a set even though each one taken on its own has a low predictive validity among selected students.
However, in order to get to his main point Dawes had to explain why the correlations would be negative in the first place. He offered the explanation rather briefly and described it in the context of graduate admissions. But it actually refers to (I believe) a very general phenomenon. The key fact to grasp is this: Dawes found, consistently across multiple cohorts, that the correlation between GRE and GPA was negative among admitted students but positive among applicants.
This isn’t restriction of range. Restriction of range attenuates correlations – it pushes them toward zero. As I’ll show below, this phenomenon can easily flip signs and even make the absolute value of a correlation go from zero to substantial.
Instead, it is a result of a multivariate selection process. Grad school admissions committees select for both GRE and GPA. So the selection process eliminates people who are low on both, or really low on just one. Some people are very high on both, and they get admitted. But a lot of people who pass through the selection process are a bit higher on one than on the other (relative to each variable’s respective distributions). Being really excellent on one can compensate for only being pretty good on the other and get you across the selection threshold. It is this kind of implicitly compensatory relationship that makes the correlation more negative in the post-selection group than in the pre-selection group.
To illustrate, here is a figure from a simulation I ran. On the left X and Y are sampled from a standard normal distribution with a population correlation of rho =.30. The observed correlation among 500 cases is r = .26. On the right I have simulated a hard-threshold selection process designed to select cases in the top 50% of the population. Specifically, cases are selected if X + Y > 0. Among the 239 cases that passed the selection filter, the observed correlation is now r = -.25. The correlation hasn’t been attenuated — it has been flipped!
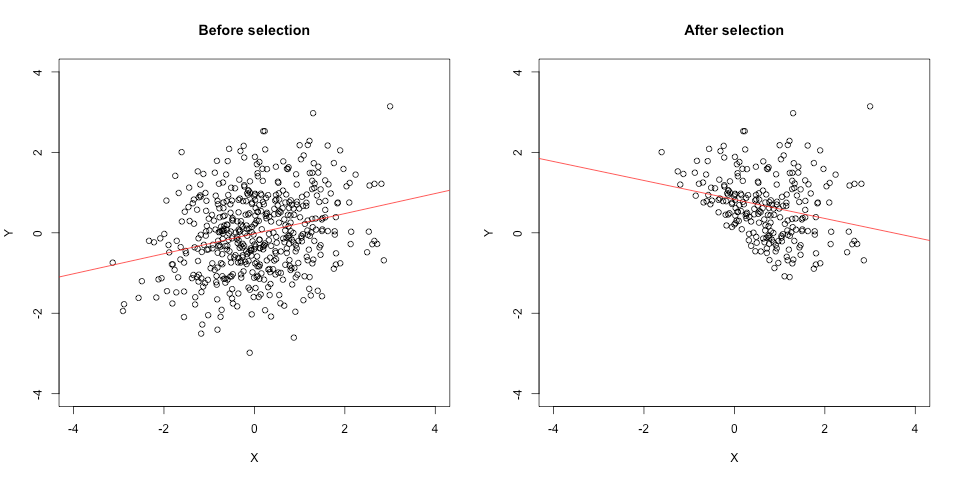
Eyeballing the plot on the right, it’s pretty obvious that a selection process has taken place — you can practically draw a diagonal line along the selection threshold. That’s because I created a hard threshold for illustrative purposes. But that isn’t necessary for the distortion effect to occur. If X and Y are just 2 of several things that predict selection, and/or if they are used in the selection process inconsistently (e.g., with random error as you might expect with human judges), you’ll still get the effect. So you can get it in samples where, if you only had the post-selection dataset to look at, it would not be at all obvious that it had been selected on those variables.
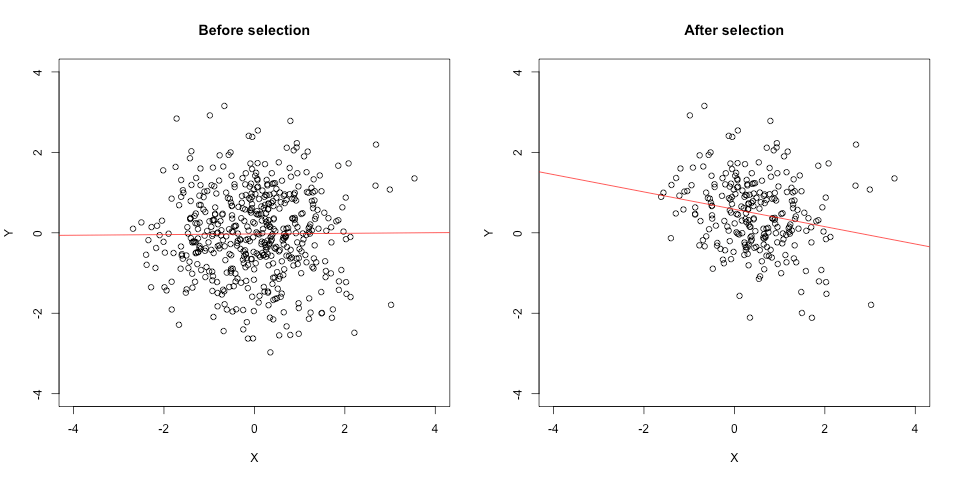
To illustrate, I ran another simulation. This time I set the population correlation to rho = .00 and added another uncorrelated variable, Z, to the selection process (which simulates a committee using things other than GRE and GPA to make its decisions). The observed pre-selection correlation between X and Y is r = .01; in the 253 cases that passed through the selection filter (X + Y + Z > 0), X and Y are correlated r = -.21. The correlation goes from nil to negative, increasing in absolute magnitude; and the scatterplot on the right looks a lot less chopped-off.
As I mentioned it above, once I wrapped my head around this phenomenon I started seeing it in a lot of places. Although Dawes found it among GPA and GRE, it is a statistical issue that is not particular to any one subject-matter domain. You will see it any time there is selection on a combination of 2 variables that allows them to compensate for each other to any degree. Thus both variables have to be part of one selection process: if you run a sample through 2 independent selection filters, one on X while ignoring Y and one on Y while ignoring X (so they cannot compensate for each other), the correlation will be attenuated by restriction of range but you will not observe the selection-distortion effect.[2]
Here are a few examples where I have started to wonder if something like this might be happening. These are all speculative but they fit the pattern.
- Studies of intellectual ability and academic motivation among college students. You have to have some combination of intelligence and motivation in order to succeed academically and get into college. So the correlation between those two things is probably different among college students than in the pre-selection pool of applicants (and the general population), especially when looking at selective colleges. For example, in a sample of Penn students, Duckworth et al. (2007) reported that grit was negatively correlated with SAT scores. The authors described the finding as “surprising” and offered some possible explanations for it. I’d add the selection-distortion effect to the list of possible explanations.
To be clear, I am not saying that the negative correlation is “wrong.” That may well be a good unbiased estimate of the correlation at Penn. This is about what populations it would and wouldn’t generalize to. You might find something similar at selective colleges and universities, but perhaps not in the general population. That’s something that anybody who studies ability and motivation in university subject pools should be aware of.
2. The correlation between research productivity and teaching effectiveness. In a recent op-ed, Adam Grant proposed that universities should create new research-only and teaching-only tenure tracks. Grant drew on sound thinking from organizational psychology that says that jobs should be organized around common skill sets. If you are going to create one job that requires multiple skills, they should be skills that are positively correlated so you can hire people who are good at all parts of their job. Grant combined that argument with evidence from Hattie & Marsh (1996) that among university professors, research productivity and teaching effectiveness have a correlation close to zero. On that basis he argued that we should split research and teaching into different positions.
However, it is plausible that the zero correlation among people who have been hired for R1 tenure-track jobs could reflect a selection-distortion effect. On the surface it may seem to people familiar with that selection process that research and teaching aren’t compensatory. But the studies in the Hattie & Marsh meta-analysis typically measured research productivity with some kind of quantitative metric like number of publications or citations, and overwhelmingly measured teaching effectiveness with student evaluations. Those 2 things are pretty close to 2 of the criteria that weigh heavily in hiring decisions: an established record of scholarly output (the CV) and oral presentation skills (the job talk). The latter is almost certainly related to student evaluations of teaching; indeed, I have heard many people argue that job talks are useful for that reason. Certainly it is plausible that in the hiring process there is some tradeoff between an outstanding written record and a killer job talk. There may be something similar on the self-selection side: Ph.D. grads who aren’t interested and good at some combination of research and teaching pursue other kinds of jobs. So it seems plausible to me that research and teaching ability (as these are typically indexed in the data Grant cites) could be positively correlated among Ph.D. graduates, and then the selection process is pushing that correlation in a negative direction.
- The burger-fry tradeoff. Okay, admittedly kinda silly, but hear me out. Back when I was in grad school I noticed that my favorite places for burgers usually weren’t my favorite places for fries, and vice versa. I’m a enough of That Guy that I actually thought about it in correlational terms (“Gee, I wonder why there is a negative correlation between burger quality and fry quality”). Well years later I think I finally found the answer. The set of burger joints I frequented in town was already selected — I avoided the places with both terrible burgers and terrible fries. So yeah, among the selected sample of places I usually went to, there was a negative correlation. But I bet if you randomly sampled all the burger joints in town, you’d find a positive burger-fries correlation.
(Like I said, once I wrapped my head around the selection-distortion effect I started seeing it everywhere.)
What does this all mean? We as psychologists tend to be good at recognizing when we shouldn’t try to generalize about univariate statistics from unrepresentative samples. Like, you would not think that Obama’s approval rating in your subject pool is representative of his national approval. But we often try to draw generalizable conclusions about relationships between variables from unrepresentative samples. The selection-distortion effect is one way (of many) that that can go wrong. Correlations are sample statistics: at best they say something about the population and context they come from. Whether they generalize beyond that is an empirical question. When you have a selected sample, the selection-distortion effect can even give you surprising and even counterintuitive results if you are not on the lookout for it.
=====
1. Honestly, I’m more than a little afraid that somebody is going to drop into the comments and say, “Oh that? That’s the blahblahblah effect, everybody knows about that, here’s a link.”
2. Also, this may be obvious to the quantitatively-minded but “selection” is defined mechanistically, not psychologically — it does not matter if a human agent deliberately selected on X and Y, or even if it is just an artifact or side effect of some other selection process.